Why per 90 minutes matters for player props
A per-90 figure rescales a player's output to a full match, so you can compare a starter who played 90 minutes with a substitute who played 20 on the same footing. Take the raw stat, divide it by minutes played, then multiply by 90. It's one of the most useful comparisons in props research and one of the easiest to misread, because a big per-90 from a player with barely any minutes is a small, noisy sample dressed up as a rate.
Team FootyMetrics
Updated Jul 2026 · 6 min read
- Per 90 is the raw stat divided by minutes played, times 90. It answers how much a player would do across a full match at their current rate.
- It fixes the main problem with raw totals: a starter and a substitute rack up wildly different minutes, so their season totals aren't comparable until you rescale them.
- A high per-90 from a low-minutes player is a trap. Two shots in a 30-minute cameo projects to six shots per 90, but it's one appearance, not a reliable rate.
- Per 90 only means something above a minutes threshold. Below a few hundred minutes, treat the number as a hint, not a rate.
- Bookmakers price a prop line for the minutes a player is expected to get, so a rotation risk or a likely early substitution can wreck the value even when the per-90 looks strong.
Per 90 is the number that lets you compare players who don’t play the same amount. Two forwards can both have eight goals and be completely different players once you account for how long each spent on the pitch to get there.
What per 90 actually is
Per 90 takes any counting stat, shots, tackles, key passes, touches in the box, and expresses it as a rate over a full match. The calculation is simple: divide the stat by the minutes the player was on the pitch, then multiply by 90.
A midfielder with 40 shots across 2,000 minutes has 40 / 2,000 x 90, which is 1.8 shots per 90. A striker with 50 shots in 2,500 minutes has 50 / 2,500 x 90, which is the same 1.8 per 90. Their raw totals differ by ten shots, but they’re shooting at the same rate once you account for the time each spent playing. That’s the whole point of the number: it puts players on a per-match footing regardless of how many matches, or how much of each match, they actually played. FootyMetrics tracks minutes alongside every counting stat, so the per-90 rate is just the ratio between the two.
Why raw totals mislead when minutes differ
Raw season totals reward availability, not rate. A player who starts every week will out-total a player who comes off the bench even if the substitute is more productive per minute, simply because the starter has far more minutes to accumulate in.
Say two forwards have both scored eight goals this season. On the surface they look identical. But if one started 30 matches for 2,700 minutes and the other managed eight goals in 900 minutes off the bench and in the odd start, they aren’t the same player at all. The first is scoring at 0.27 per 90; the second at 0.80 per 90. Raw totals hid that completely. The bench player is finishing at nearly three times the rate, and that only shows up once you rescale for minutes.
This is exactly why per 90 is the right lens for a lot of props work. A prop line is set for a single match, so a per-match rate is closer to what you’re actually betting on than a season total that lumps 30 games together.
A worked example: the sub who looks electric
Here is the trap. A starter plays the full 90 minutes and has 3 shots, a per-90 of 3.0, which is a strong return for a genuine goal threat. A substitute then comes on for the last 30 minutes of the same match and has 2 shots. Run the sub through the formula: 2 / 30 x 90 = 6 shots per 90, double the starter’s rate.
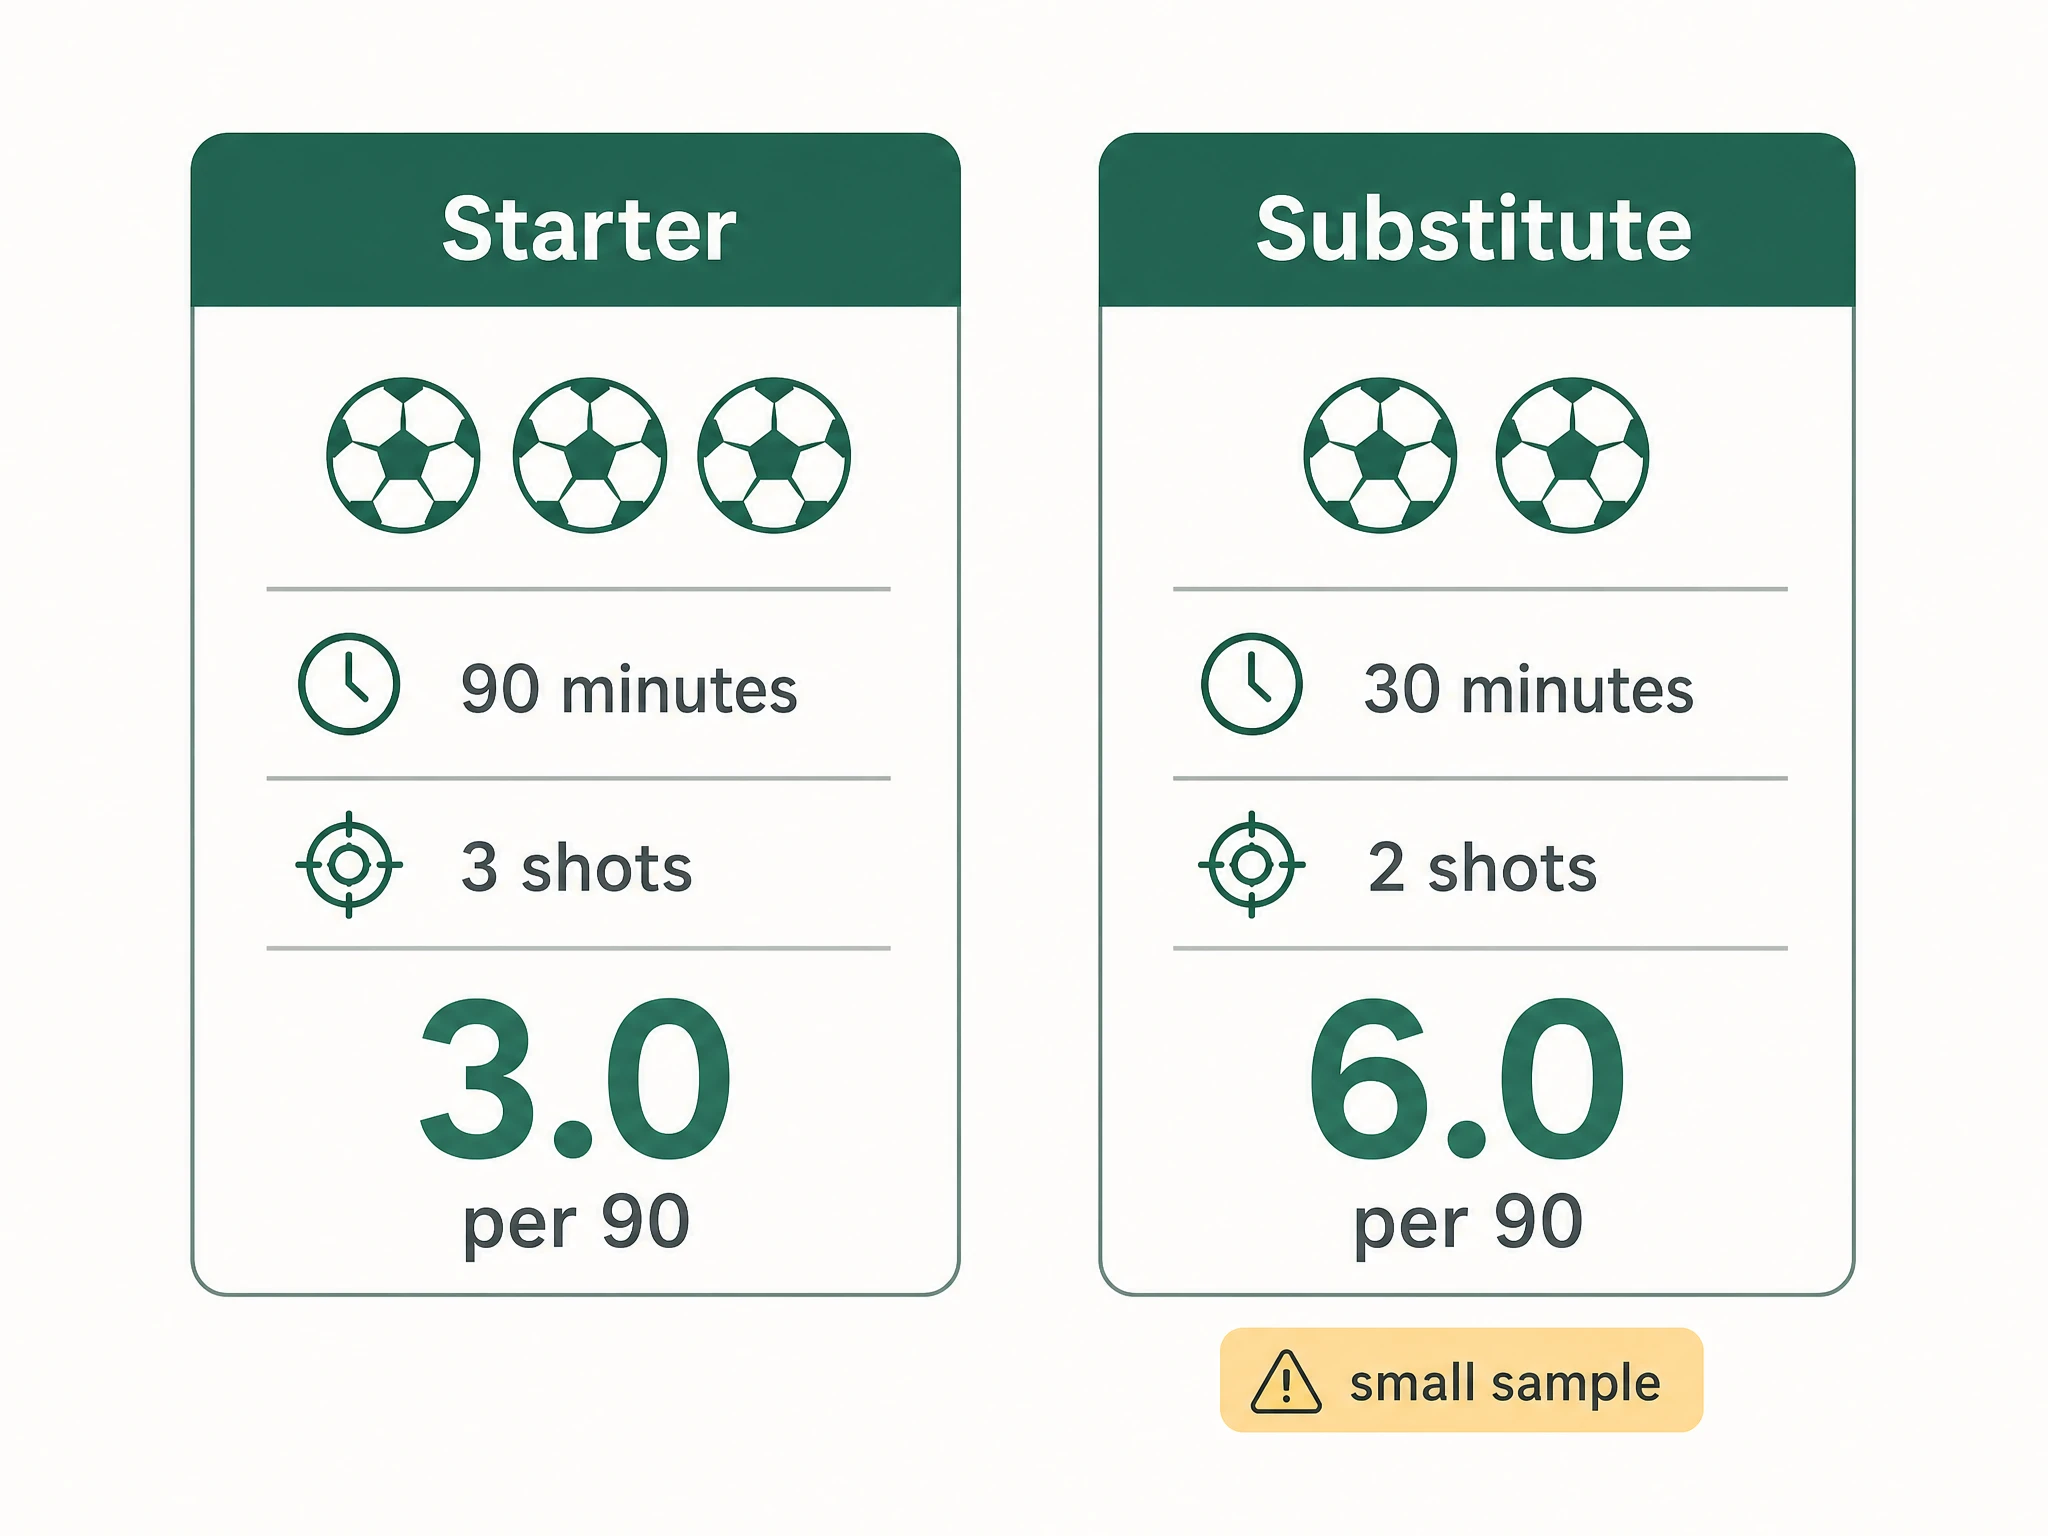
Six shots per 90 is an elite rate. Almost no established starter sits that high across a season. If you sorted a props table by shots per 90 and this player had a minutes filter switched off, they’d top it, ahead of every genuine high-volume shooter in the league.
But it’s one cameo. Thirty minutes is a third of a match. The two shots might have come because the player’s team was chasing a goal late and throwing bodies forward, a situation that inflates shot counts for anyone on the pitch. Extend that same player over a full 90 and they’re far more likely to regress toward a normal rate than to keep firing off six shots a game. The per-90 figure took a single burst and presented it as a sustained rate it has done nothing to earn.
The problem isn’t the arithmetic. Two shots in 30 minutes genuinely is six per 90 at that moment. The problem is treating a rate built on 30 minutes as if it carries the same weight as one built on 2,500.
Why per 90 needs a minutes threshold
A rate is only as trustworthy as the sample it’s built on. The fewer minutes behind a per-90 number, the more a single good or bad spell swings it, which is the same small-sample problem that governs any short betting record. One hot cameo can double a low-minutes player’s per-90; one quiet one can halve it. Over 2,000 minutes, no single match can move the rate much at all.
There’s no single official cut-off, and different analysts use different ones, but the working principle holds generally: apply a minutes filter before you trust a per-90 rate, and be more sceptical the lower the minutes behind it. A few hundred minutes is often treated as a rough floor for taking a rate seriously, and a full season’s worth is more reliable again. Below the floor, read the per-90 as a hint about a player worth watching, not as a settled rate you can bet into.
A per-90 built on 30 minutes and one built on 2,500 are the same arithmetic and nothing like the same evidence.
FootyMetrics applies minutes filters on its trend and props tools for this reason, so a low-minutes player’s flattering rate doesn’t sit at the top of a table unqualified. This is the same reasoning behind variance and sample size in betting: a small sample can fake a signal in either direction, and only more of it tells you whether the rate is real.
The props angle: minutes are priced in
Here is where per 90 meets the bet slip. A bookmaker doesn’t price a shots or tackles line off a player’s per-90 rate in isolation. It prices for the minutes that player is expected to get in that specific match. A nailed-on starter expected to play 90 gets a line built for a full shift. A rotation risk or a likely early substitution gets a shorter line, because the book has already discounted for the minutes it thinks the player will actually be on the pitch.
That matters two ways. A strong per-90 rate is worth far less if the player isn’t expected to play a full match. A forward shooting at 3.0 per 90 who gets hooked on the hour isn’t a 3.0-per-90 bet on the night; they’re more like a 2.0-shot expectation, and the line will reflect that. The flip side is that the real value often sits in the gap between the minutes the market expects and the minutes you think the player will get. If you have a read that a player predicted to be rotated will actually start and go the distance, a line priced for a cameo can be genuine value.
This is why minutes risk and per 90 have to be read together. The rate tells you how productive a player is per match; the expected minutes tell you how much of that match you’re actually getting. A high per-90 from a player at real rotation risk is the props equivalent of the low-minutes trap: an attractive number attached to a situation that may never let it pay out. Most of that minutes risk sits in the gap between a guessed XI and the one the club actually names, which is the subject of predicted vs confirmed lineups.
Check the sample and the minutes, in that order
Player Props Finder
Search upcoming fixtures by rate and minutes, so a flattering per-90 on a thin sample doesn't top your list.
Per 90 minutes FAQs
Is a higher per-90 always better for a player prop?
Not on its own. A high per-90 built on very few minutes is unreliable, and a strong rate is worth little if the player isn't expected to play a full match. You have to weigh the rate against both the sample of minutes behind it and the minutes the player is likely to get in the specific fixture.
How many minutes before I can trust a per-90 rate?
There's no single official threshold, and different analysts use different ones. As a rough guide, a few hundred minutes is a common floor for taking a rate seriously, and a full season's worth of minutes is more reliable again. The fewer the minutes, the more a single match can distort the number, so treat low-minutes rates as a hint rather than a settled rate.
How do I calculate per 90 myself?
Divide the counting stat by the minutes the player was on the pitch, then multiply by 90. For example, 2 shots in 30 minutes is 2 / 30 x 90, which is 6 shots per 90. A tackle count, key passes or touches in the box all work the same way.
Why does a substitute's per-90 look so high?
Because the small minutes total amplifies whatever they did. Two shots feels ordinary across a full match but projects to six per 90 across 30 minutes. Substitutes also often come on in specific game states, such as a team chasing a goal, that inflate certain stats for anyone on the pitch. The rate is real at that moment but has a tiny sample behind it.
Do bookmakers use per 90 to set prop lines?
Bookmakers price for the minutes a player is expected to play in that match, not the player's per-90 rate in isolation. A player expected to be substituted early or rotated gets a shorter line than their full-match rate would suggest, because the book has already discounted for the minutes it thinks they'll get.
Does a strong per-90 make up for a player at rotation risk?
No. If the player doesn't start, or is pulled off early, they never get the minutes for the rate to translate into the bet. A high per-90 attached to a rotation risk is a flattering number in a situation that may never let it pay out, which is why you check expected minutes before backing a prop.