Why pass completion percentage can mislead
A high pass completion percentage often just means a player is taking on safe, low-risk passes rather than difficult ones. A centre-back playing the ball sideways under no pressure will complete it almost every time; a player trying a line-breaking pass into the box will complete a smaller share, and each one that lands usually matters more.
Team FootyMetrics
Updated Jul 2026 · 6 min read
- Pass completion percentage is completed passes divided by attempted passes. It says nothing about where the pass went or what it was trying to do.
- Goalkeepers and centre-backs typically post the highest completion rates, often 85% to 95%+, because most of their passing is short and sideways with time to pick it out.
- Wide players and forwards attempting cutbacks and through balls into the box often sit lower, sometimes well under 75%, because those passes are contested.
- A low completion rate isn't automatically a sign of ambition. It can also mean poor decision-making, so the number needs the type of pass behind it, not just the percentage.
This is a different question to the total passes betting prop, covered on total passes props: how they settle. That page is about a market settling on the volume of attempted passes, completed or not. This page is about the percentage itself as an analytics figure, and what it does and doesn’t tell you about a player’s distribution.
What pass completion percentage actually measures
Pass completion percentage is completed passes divided by attempted passes, expressed as a percentage. FootyMetrics tracks both figures, attempted and completed, for every player across the leagues it covers, and the completion rate is simply the ratio between them.
That’s the whole calculation. It treats a five-yard pass between two centre-backs with no opponent within twenty yards the same way it treats a forty-yard ball threaded between two defenders into a striker’s path. Both are one attempt. If they land, both count the same in the ratio, even though one carried close to zero risk and the other carried a lot.
Why a high number isn’t a good performance
A centre-back recycling possession sideways or back to the goalkeeper under no pressure can post a completion rate above 90% for an entire match while adding very little to their team’s attacking threat. None of those passes needed to beat a defender, split a line, or find a team-mate in a dangerous area. They just needed to reach a team-mate standing in space.
That isn’t a criticism of the centre-back. Circulating the ball safely is part of the job, and a defender who gives the ball away cheaply in their own half is a much bigger problem than one who plays it short all game. The point is narrower: a 95% completion rate on its own doesn’t tell you whether that player did anything to help their team score.
A genuinely progressive passer, someone who regularly tries the ball forward, between lines, or into the box, will complete a noticeably smaller share of attempts. Those passes are contested. A defender is often positioned to intercept them, the receiving team-mate might be tightly marked, and the margin for error on a forty-yard diagonal is much smaller than on a five-yard square ball. Each one that does land is doing far more work for the team than a routine sideways pass, even though the completion column makes the progressive passer look worse on paper.
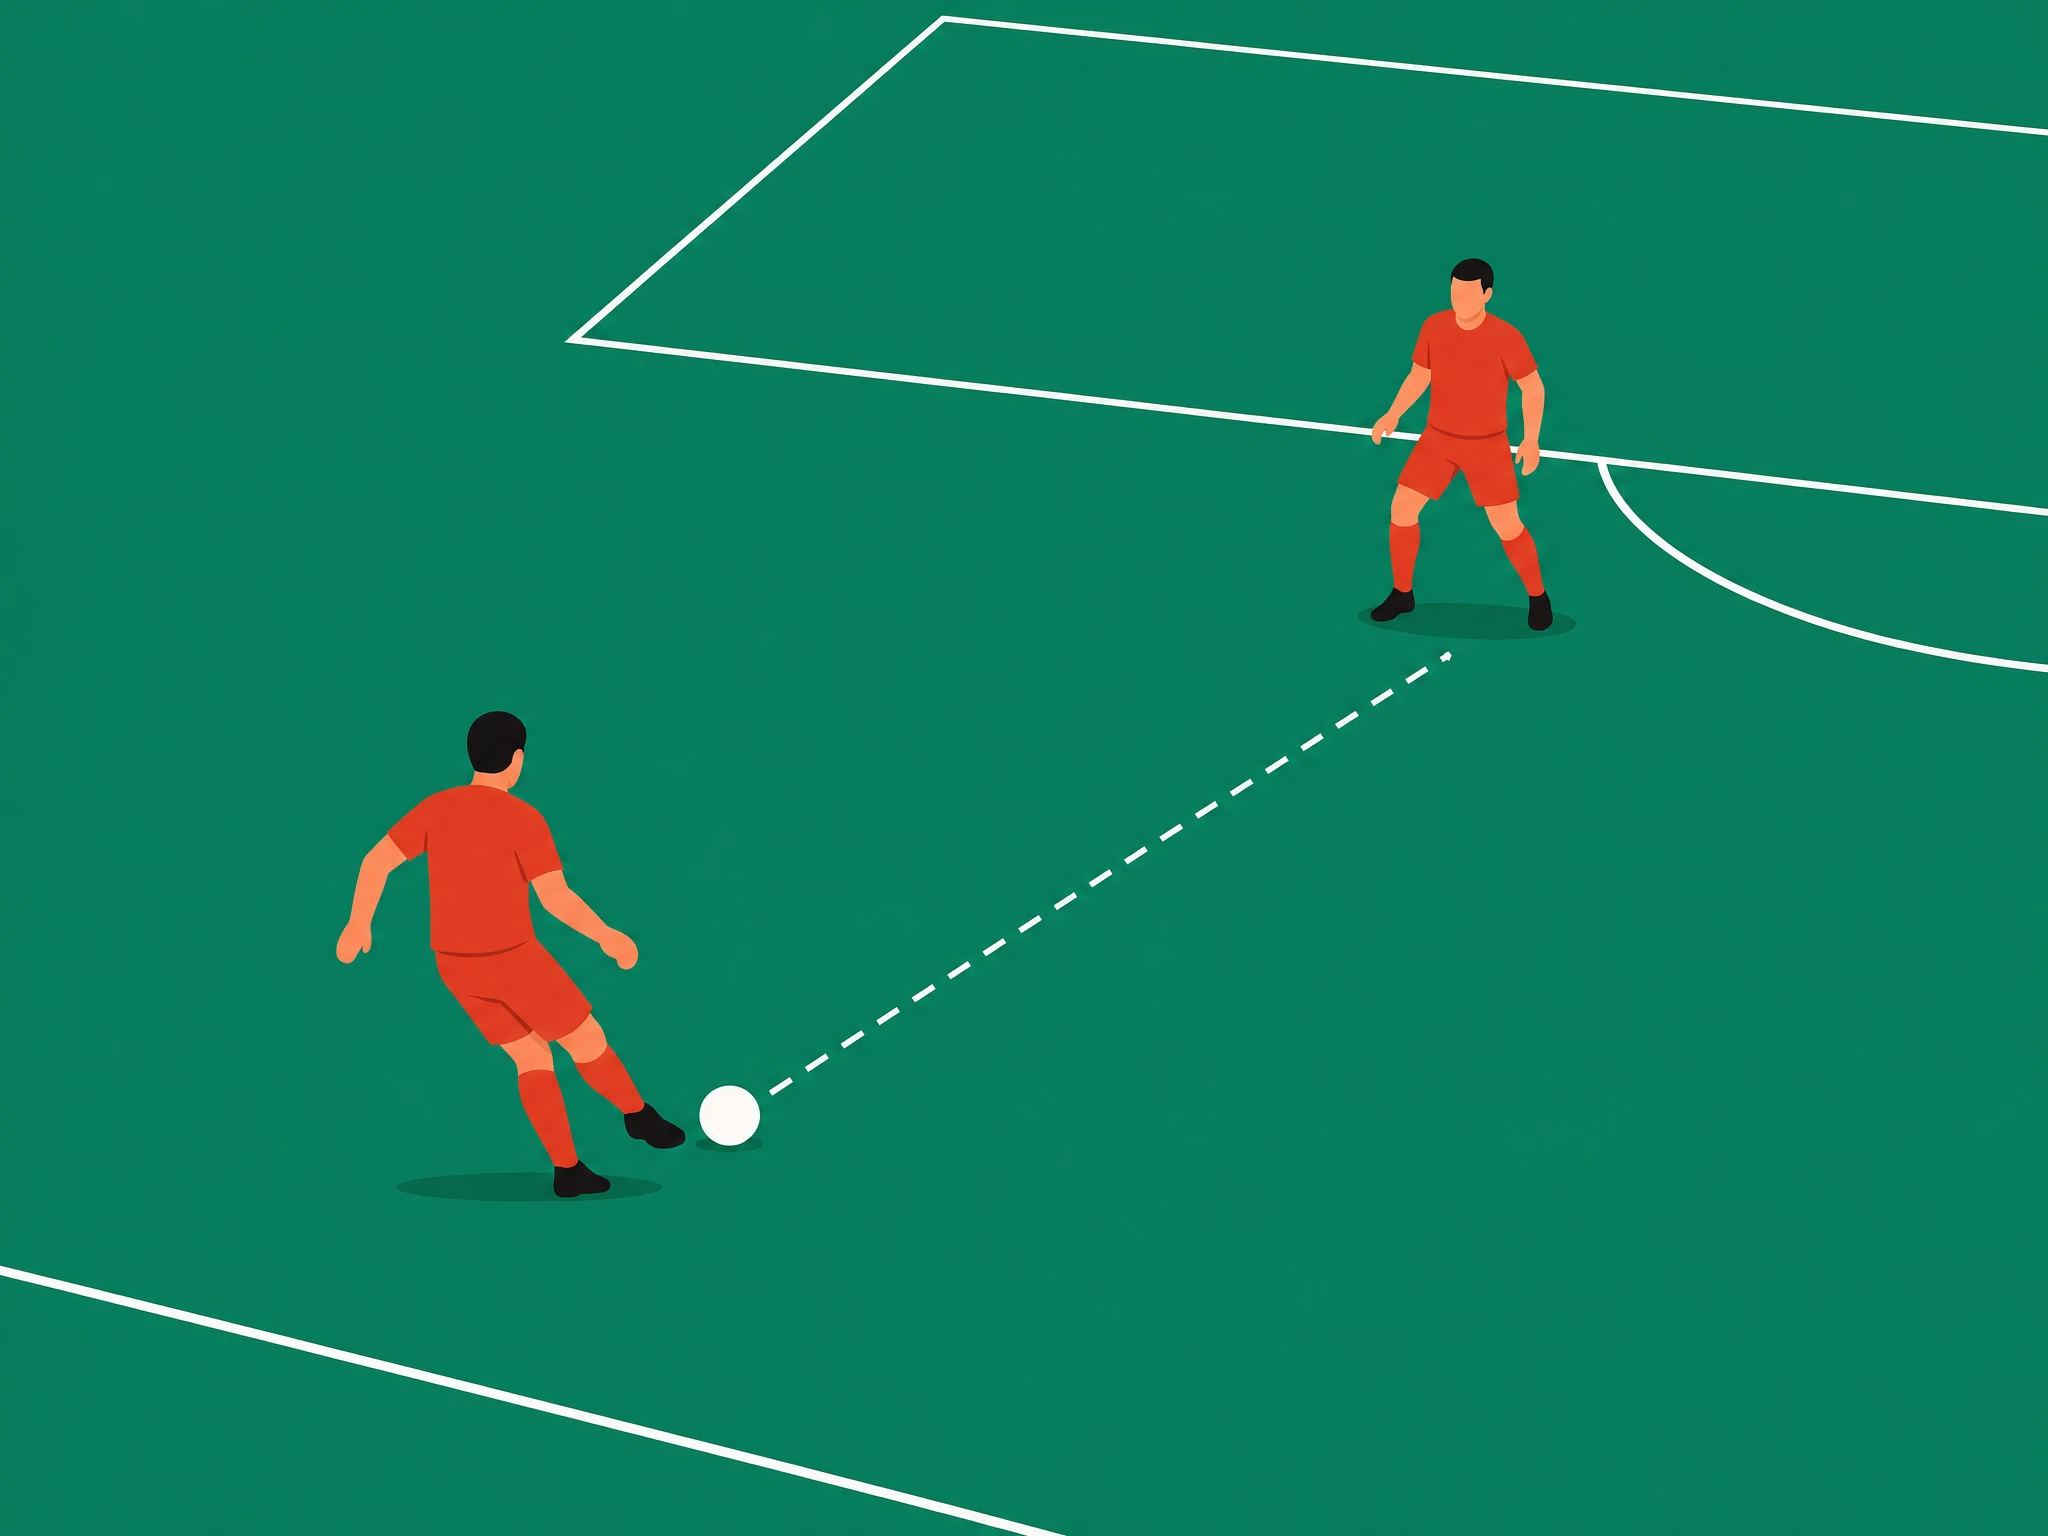
Low-risk, unmarked. Easy to complete, adds little threat.
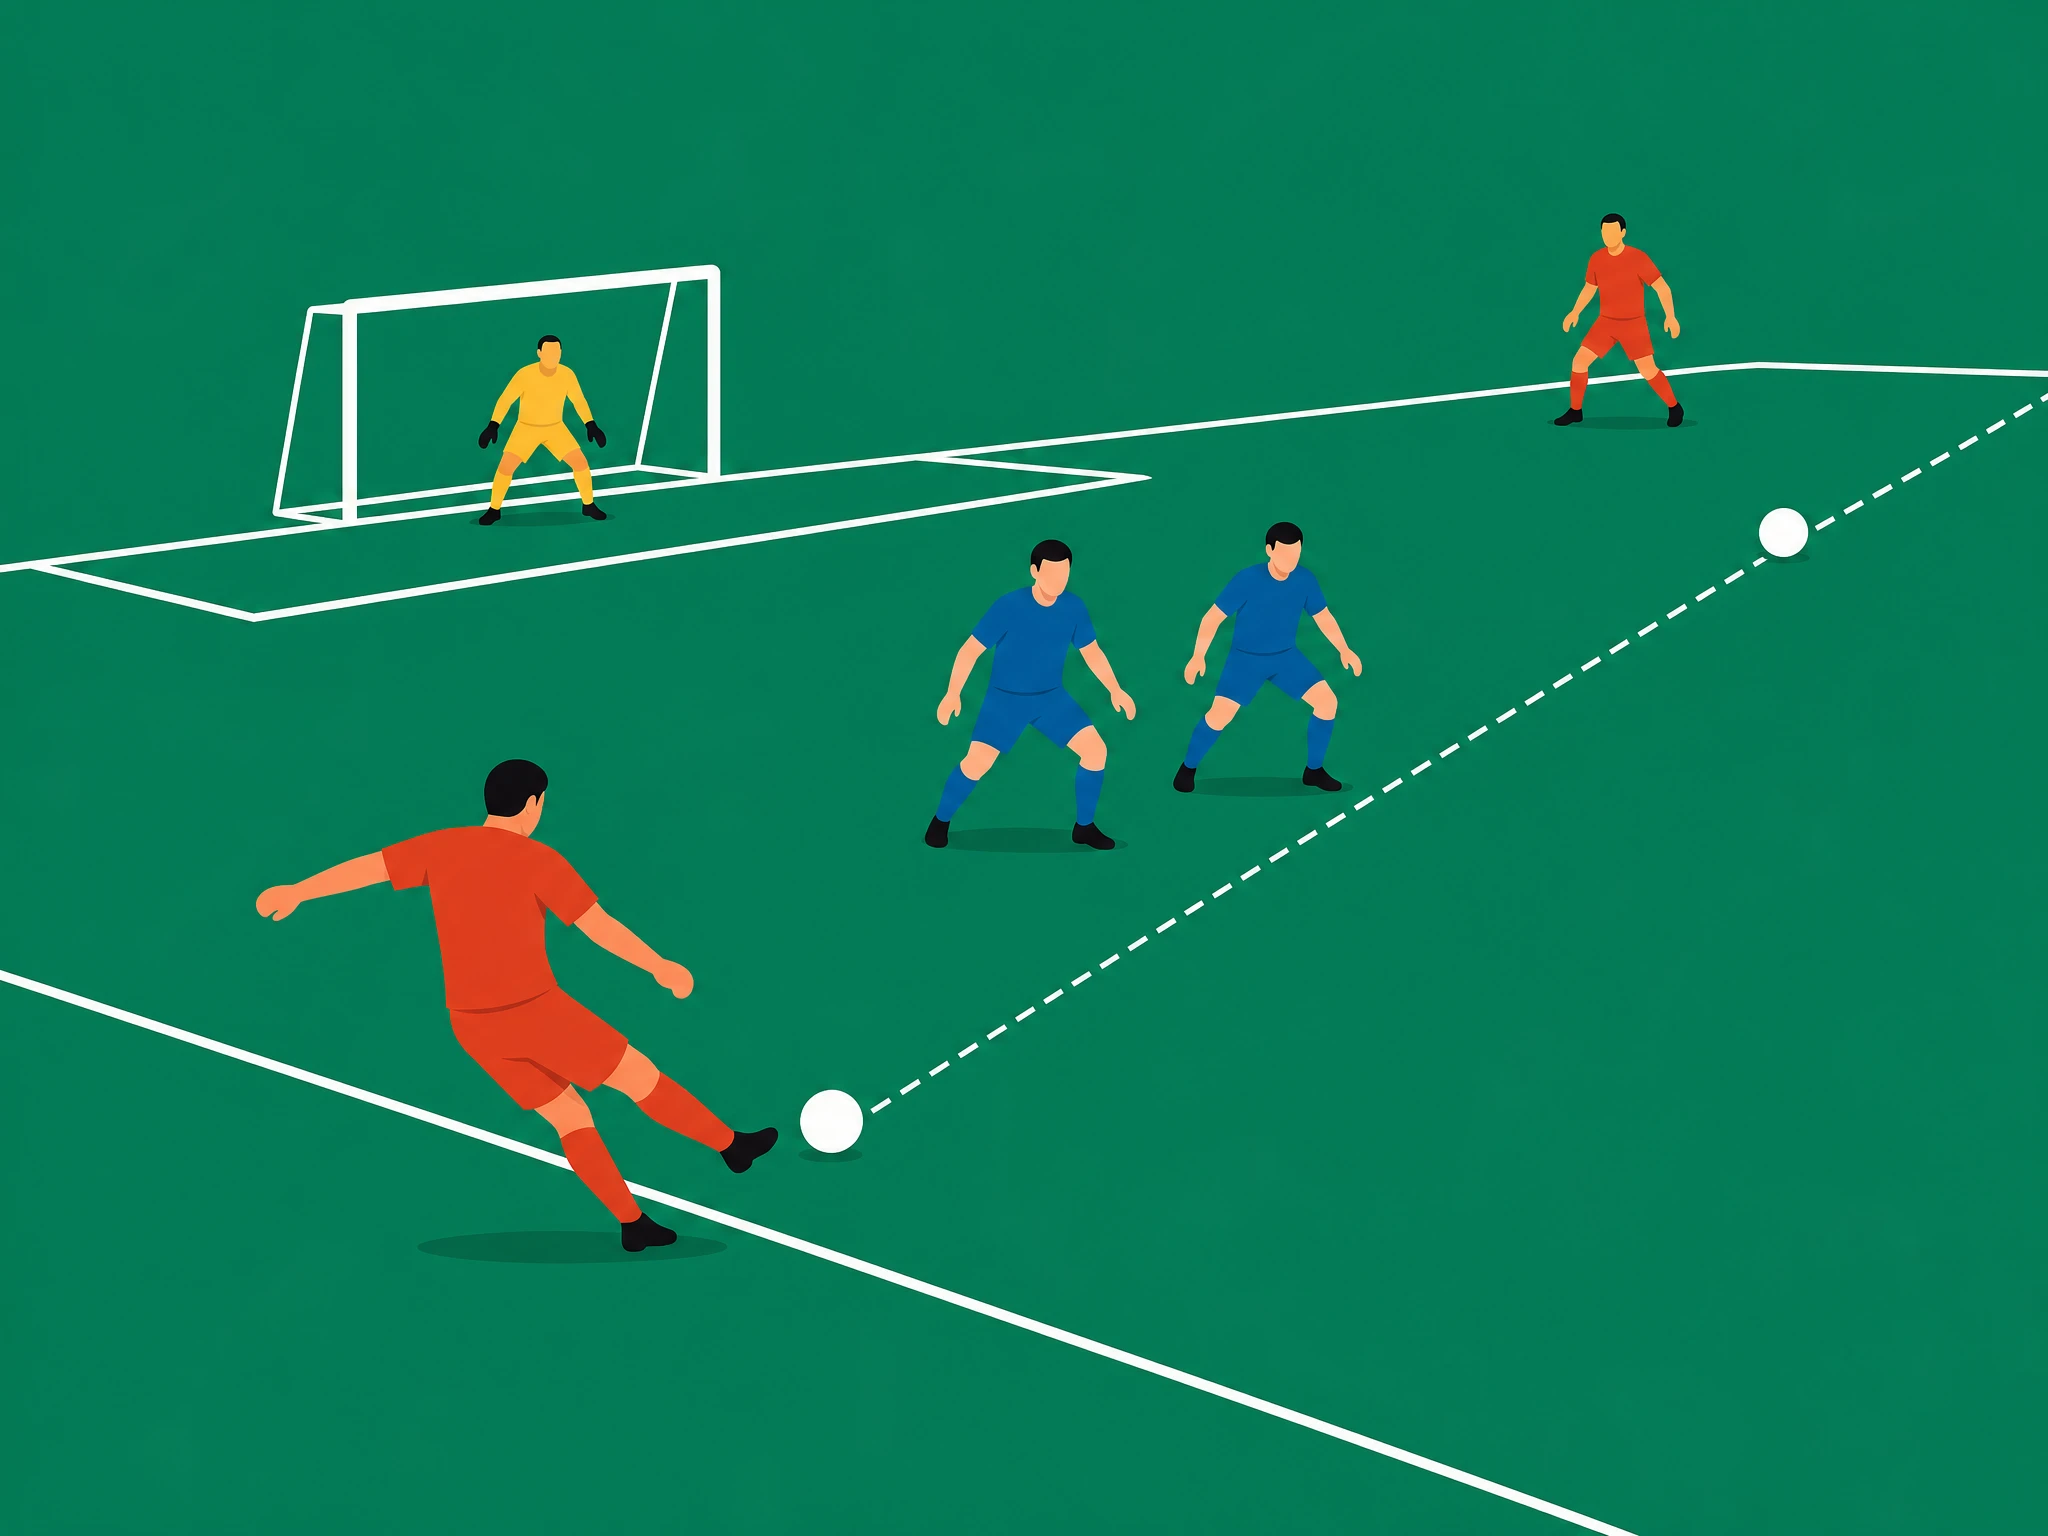
Contested, forward. Harder to complete, worth more when it lands.
Real positional patterns
Position is the biggest single driver of completion percentage, more than form or ability.
Goalkeepers and centre-backs sit at the top end. A goalkeeper playing out from the back to a covering centre-back, or a centre-back moving the ball across to their partner, faces almost no defensive pressure and has the whole width of the pitch to work with. Completion rates in the 85% to 95%+ range are normal for players in these positions across a season, because the bulk of their passing volume is short and unopposed.
Wide players and forwards sit at the other end. A winger looking for a cutback across the six-yard box, or a striker trying to thread a ball through a crowded box, is attempting a pass into a much smaller, more contested space, usually with a defender in the passing lane. Completion rates well under 75% are common for players who regularly attempt this kind of pass, and that’s not a mark against them. It’s the nature of the passes they’re being asked to try.
A holding midfielder often sits in between: more advanced and under more pressure than a centre-back, but still frequently playing sideways or backwards to keep possession ticking over, which pulls their completion rate up relative to a winger or forward.
- Goalkeepers and centre-backs, often 85% to 95%+.
- Short, sideways or backward passes with time and space.
- Little defensive pressure on the pass at the moment it's struck.
- Wide players and forwards, often well under 75%.
- Cutbacks, through balls and line-breaking passes into tight areas.
- A defender usually sitting in or near the passing lane.
Low completion isn’t always boldness
None of this means a low completion percentage should be read as a compliment by default. A player who gives the ball away repeatedly through poor decision-making, misjudging a pass that was never on, or under-hitting a simple ball under no real pressure, will also show a low completion rate, and that’s a real weakness, not a sign of a progressive passing game.
The number on its own can’t tell you which situation you’re looking at. A 68% completion rate from a winger regularly trying to find a team-mate in the box with a defender covering the pass is a different story to a 68% completion rate from a full-back giving away routine ten-yard passes under no pressure. Both show up as the same percentage. The context, what kind of pass was being attempted and how contested it was, is what actually tells you whether the number reflects risk-taking or just poor execution.
Compare within position, not across it
How this differs from other pass stats
Pass completion percentage isn’t the same thing as key passes vs assists, which looks at whether a specific pass directly led to a shot or a goal. A player can have a modest completion percentage overall and still rack up a healthy tally of key passes, because most of their unsuccessful attempts are the low-percentage forward balls that occasionally create a chance. Completion percentage is about the volume-and-risk profile of a player’s passing across the whole match. Key passes and chances created, covered on chances created explained, are about the small subset of passes that directly produced a chance.
What is PPDA is a related passing-adjacent metric worth knowing too, though it measures pressing rather than passing itself.
Pass completion percentage FAQs
Is a high pass completion percentage always a good sign?
Not on its own. It often reflects a low-risk passing role, like a centre-back or goalkeeper circulating the ball, rather than a player creating chances. The type of pass being attempted matters as much as the percentage.
What's a good pass completion percentage for a footballer?
It depends heavily on position. Goalkeepers and centre-backs are commonly in the 85% to 95%+ range. Wide players and forwards attempting riskier forward passes are often well under 75%. Neither figure is inherently better, they reflect different jobs.
Why do wingers and strikers have lower pass completion than defenders?
Because the passes they attempt are more difficult. A winger looking for a cutback or a striker trying a through ball is aiming at a smaller, more contested space, usually with a defender in the way, compared to a centre-back playing a simple ball to a team-mate in space.
Is pass completion percentage the same as the total passes betting prop?
No. The total passes prop settles on the volume of attempted passes, completed or not. Pass completion percentage is a ratio: completed passes divided by attempts. They're different stats built from the same underlying passes.
Does a low pass completion percentage mean a player is careless with the ball?
It can, but not always. A low rate can come from a player attempting difficult, high-value forward passes, or from a player making poor decisions on simple ones. The number alone doesn't distinguish between the two, you need to look at what kind of passes the player is actually attempting.
Is pass completion the same as key passes?
No. Key passes measure whether a specific pass led directly to a team-mate's shot. Pass completion percentage measures the success rate of a player's passing overall, regardless of whether any of those passes led to a chance.