What is expected goals (xG)?
Expected goals (xG) is a number between 0 and 1 that measures how likely a single shot was to be scored, based on the outcomes of thousands of similar shots in the past. A penalty sits close to 1. A tight-angle shot from 30 yards can sit close to 0.
Team FootyMetrics
Updated Jul 2026 · 7 min read
- xG measures the quality of a single shot: how likely it was to be scored, based on the historical outcomes of similar shots. It is not a prediction of the final score.
- It's built from the shot itself (distance, angle, body part) and the situation around it (assist type, defensive pressure, whether it was a one-on-one or a big chance).
- A team can lose a match while recording more xG than the winner. That's an argument about performance rather than result, not proof the result was wrong.
- FootyMetrics shows xG (and xA) as selectable stats per player. They sit alongside shots, shots on target, big chances created or missed, and shots created, so you get chance quality and volume in one place.
That's the short version. xG gets thrown around constantly in commentary and on social media, usually to argue a team deserved something the scoreline didn't give them. It measures shot quality, not luck, and not who actually won.
What is expected goals (xG)?
Expected goals measures the quality of a shot: the statistical likelihood that it results in a goal, based on the historical outcomes of similar shots. Every shot gets a value between 0, almost no chance, and 1, a near-certain goal. Opta's own definition is that xG measures the quality of a shot based on several variables such as assist type, shot angle and distance from goal, whether it was a headed shot and whether it was defined as a big chance.
The idea behind it is comparison. Analytics providers hold data on hundreds of thousands of past shots. A new shot gets compared to the group of past shots that looked like it, and the proportion of that group that ended up as goals becomes the xG value. A shot from the penalty spot with nobody in the way sits close to 1, because almost every shot like it goes in. A rushed effort from 30 yards with a defender in the way sits close to 0, because almost none of them do.
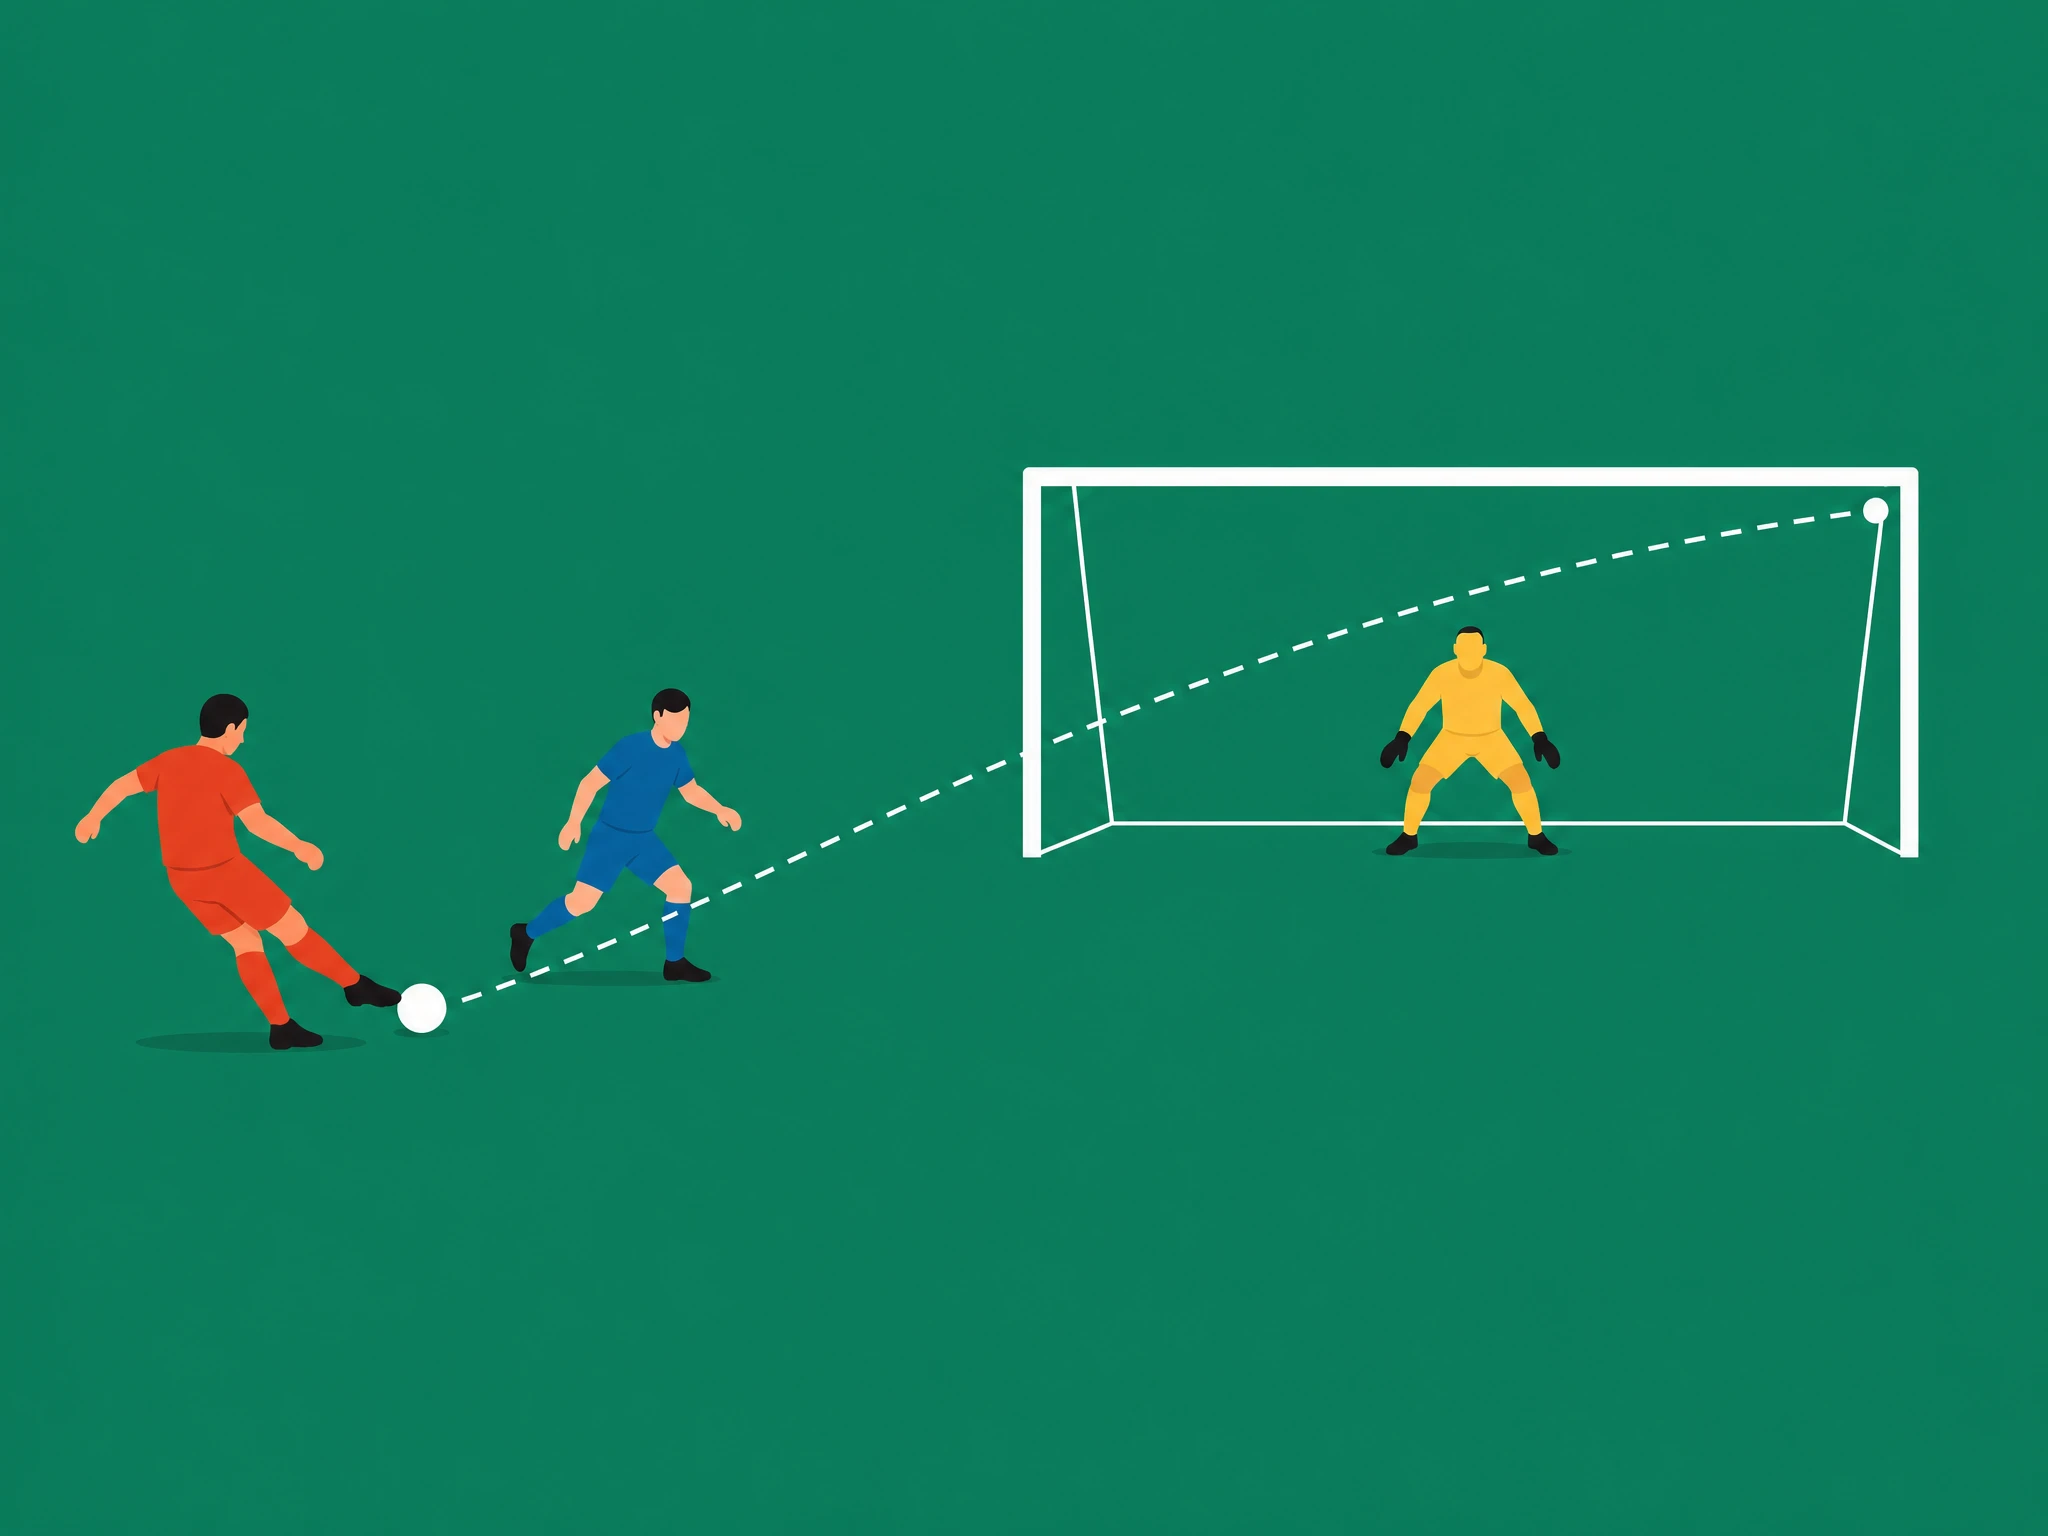
Long range, tight angle, defender in the way. Low xG.
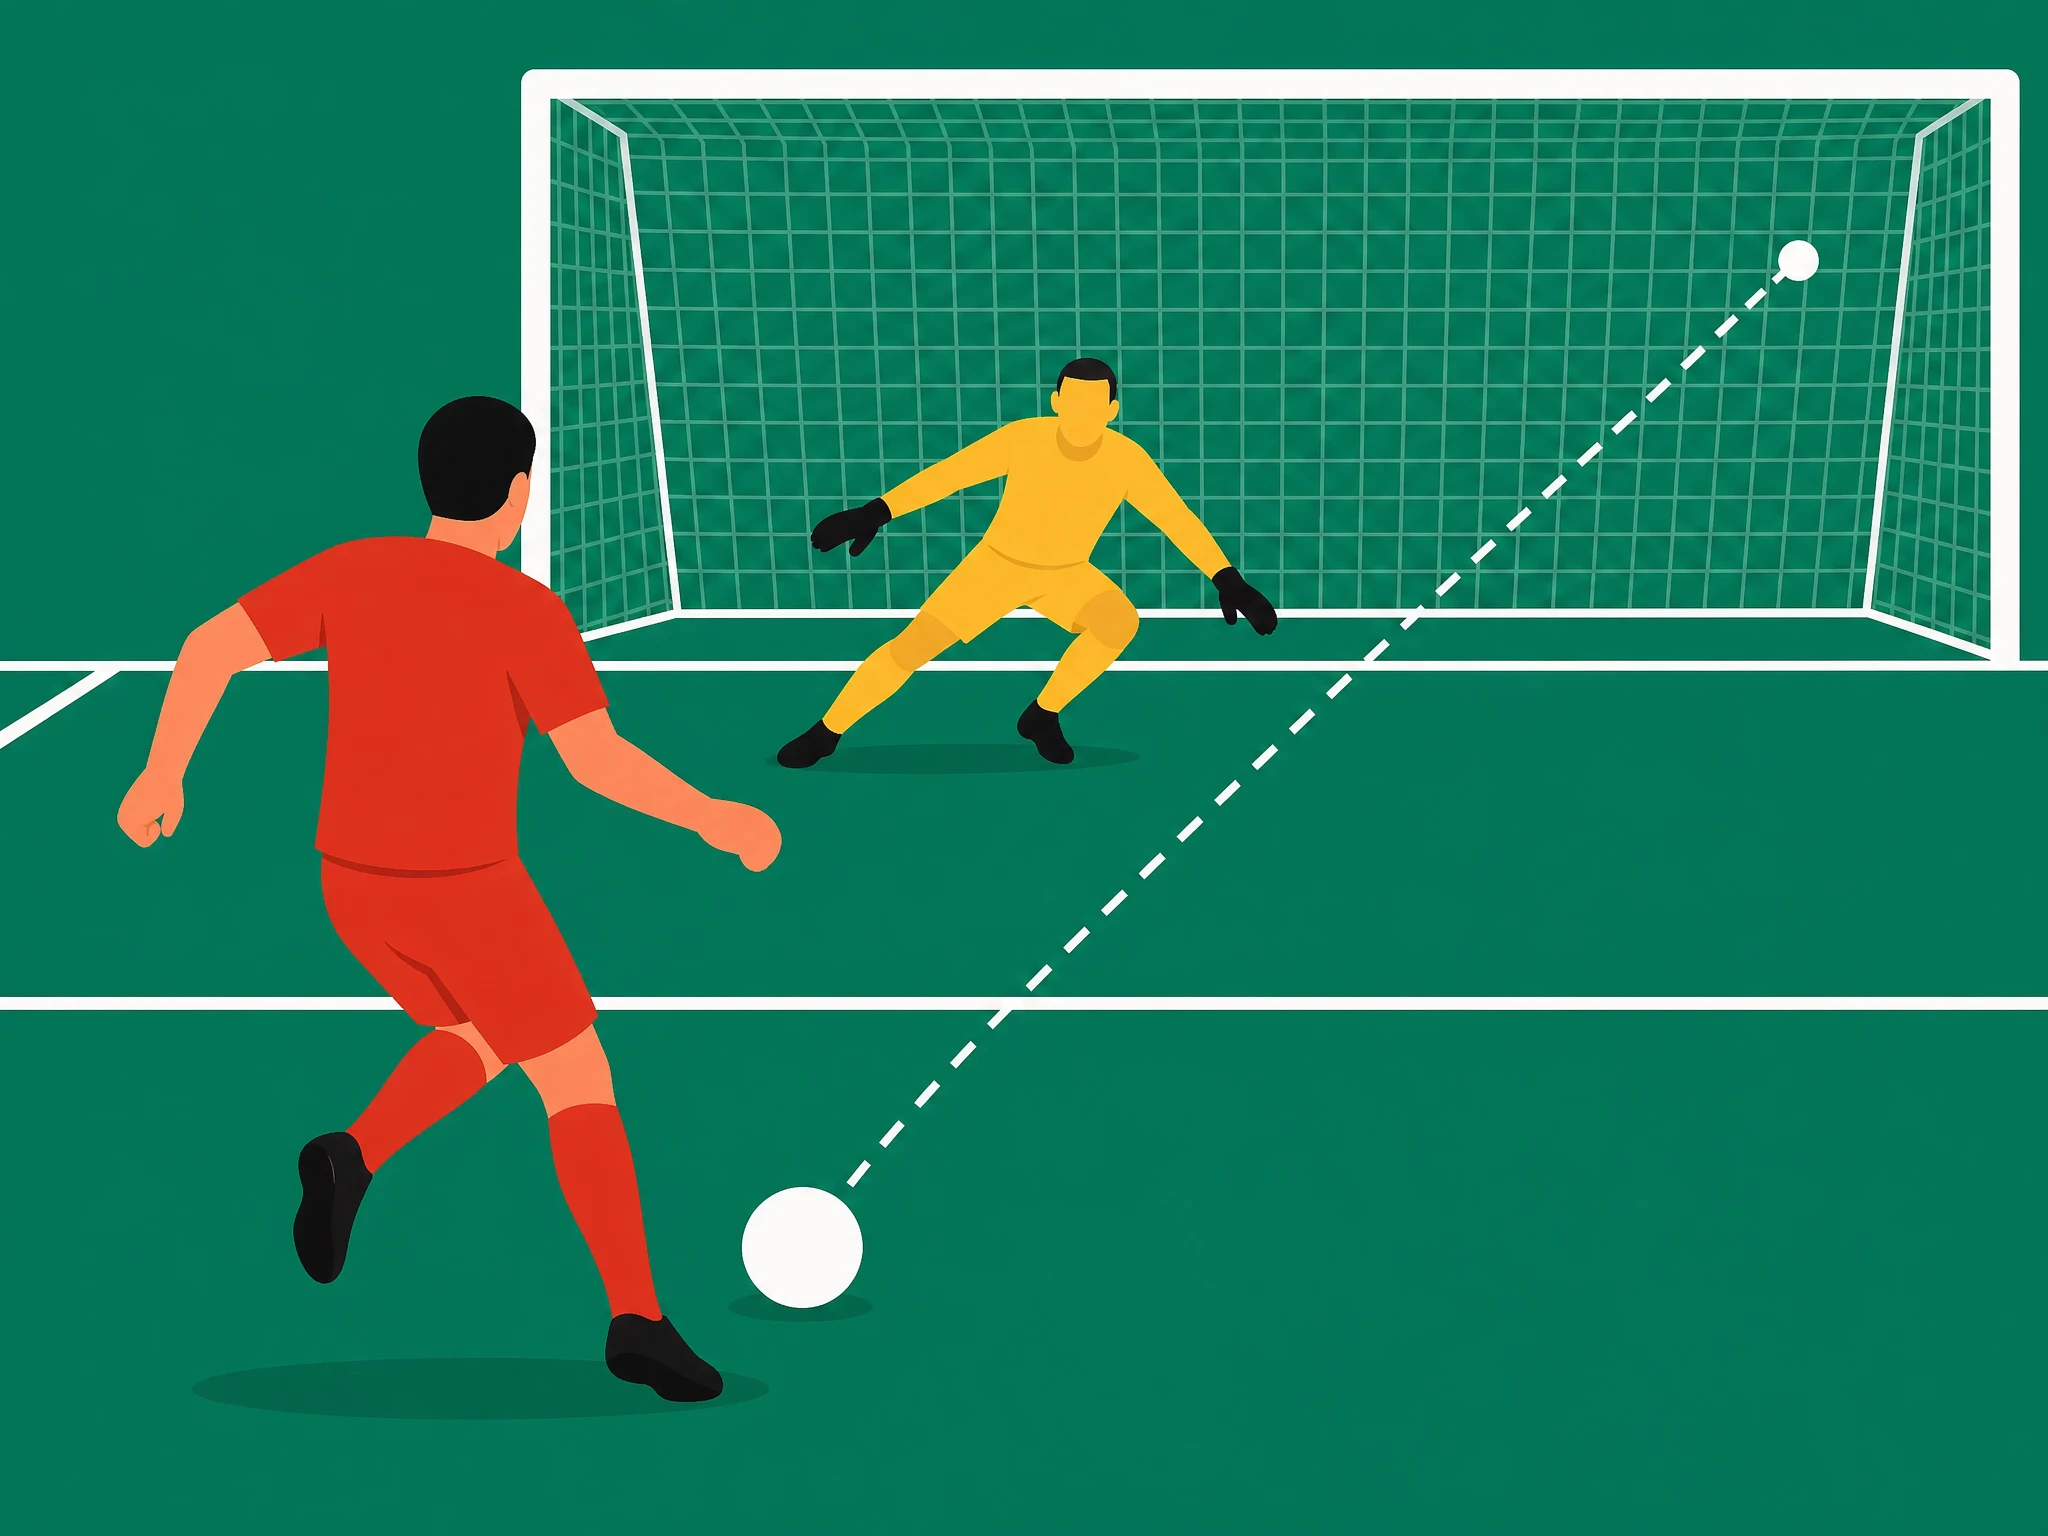
Close range, one-on-one, keeper off their line. High xG.
What actually feeds an xG model
An xG model is not just distance from goal. Opta's model runs on more than 20 variables, and the main ideas show up across every serious provider.
- Distance and angle to goal. The closer and more central the shot, the higher the base probability.
- Body part. A header converts less often than a shot with the stronger foot from the same spot, so the model weighs it differently.
- The type of assist or pass that created the chance. A through ball or a cutback tends to produce a better chance than a shot out of a static, crowded build-up.
- Defensive pressure and goalkeeper position. How many defenders stand between the shooter and goal, how much pressure they're under, and where the goalkeeper is standing all move the number. StatsBomb's version of the model specifically tracks the positions of the goalkeeper and defenders around every shot.
- Whether it was a one-on-one. A shot with only the goalkeeper to beat is treated differently to the same shot with cover behind them.
- Whether it was a big chance. Opta explicitly includes big chance status as one of the inputs to its own xG number, alongside shot angle, distance and body part.
Penalties are handled separately from open-play shots. Because almost every penalty is struck from the same spot under the same conditions, Opta doesn't run the full model on them. It gives penalties a constant value reflecting their historical conversion rate, 0.79 xG, according to Opta Analyst.
xG per shot vs xG over a match or season
A single shot's xG is just that shot's probability. A team's xG for a match is the sum of every shot they had: three shots worth 0.1, 0.2 and 0.4 add up to 0.7 xG for the game. Over a season, the same addition happens across every match, which is how a player or team ends up with a seasonal xG total.
This is where the familiar argument comes from: a team lost but had more xG than the winner. It's a way of separating the chances a team created from the goals that actually went in. A team generating the better shots over 90 minutes made the more threatening football, even if the finishing, a good save, or a bit of luck went the other way on the night. It's a genuinely useful way to look past a single scoreline, especially over a run of matches rather than one game.
It isn't proof the result was wrong. Football has 90 minutes and a small number of shots in most matches, so randomness plays a real part in any single game. xG describes the shots that were taken. It says nothing about a red card, a refereeing decision, or a goalkeeper having the game of their life.
Goals vs xG: overperformance and underperformance
Because every shot has an xG value, you can compare what a player or team actually scored against what their shots "should" have produced. A striker who scores 15 goals from shots worth 10 xG in total is outscoring their underlying chances. One who scores 6 goals from 12 xG worth of shots is scoring less than the quality of their chances suggests.
This gap gets read as finishing above or below expectation, and it's a real pattern worth watching. It isn't a guaranteed forecast, though. Opta Analyst's own look at hot scoring streaks found that a run of overperformance does not automatically have to reverse for the numbers to catch up, since the goals already scored are banked either way. Differences between goals and xG can be driven by randomness over a small number of matches, by genuine finishing skill, or by limits in the model itself, and separating those out isn't straightforward from a handful of games.
Reading an xG gap
Non-penalty xG (npxG)
Because a penalty is scored so much more often than an open-play shot, one converted penalty can flatter a player's or team's overall xG picture. Non-penalty xG, usually written npxG, is the same measure with penalty shots stripped out, so it isolates the quality of chances created from open play and set pieces like corners and free kicks. It's the more useful number when the question is how good a team's or player's chances are from general play, rather than how many goals they've scored in total.
What xG is not
It doesn't predict a specific match result. xG measures chance quality, not who wins. xG totals from a single match can be volatile, and the gap between xG and actual goals over a small sample can come from randomness as well as anything systematic. A team can lead comfortably on xG and still lose to a red card, a moment of individual quality, or a goalkeeper having an outstanding night.
It isn't the same as a "big chance." A big chance is a separate, discrete tag applied to a shot, defined as a situation where a player would reasonably be expected to score, usually a one-on-one or a very close-range effort with a clear path to goal and low to moderate pressure. Every penalty is automatically counted as a big chance. xG is a continuous probability calculated from many inputs, of which whether a shot was a big chance is only one. In practice a big chance usually carries a high xG value, but the two aren't interchangeable: xG is the number, big chance is a yes or no tag on the clearest kind of opportunity.
See xG on FootyMetrics
Alongside xG and xA, we track shots, shots on target, big chances created and missed, and shots created, per player across our covered leagues.
See xG on every player page
Expected goals (xG) and expected assists (xA) are selectable on any player's page, alongside shots, shots on target and big chances, across our covered leagues.
Team and player goal totals sit alongside that on the goals leaderboard, which is the closest read on actual output to compare against those chance numbers.
Where our AI predictions fit
FootyMetrics' AI match predictions aren't built from a single xG number. A model built to forecast a match outcome draws on more than shot quality alone, including recent team and player form, head-to-head history, and the underlying stats we track like xG, shots on target and big chances. xG is one idea analytics providers use to describe chance quality, and you can read it directly on our player pages, but on its own it isn't the whole picture a prediction model needs.
AI match predictions
See our predictions for every match, across 115+ leagues, built from more than one number.
Expected goals (xG) FAQs
What does xG mean in football?
Expected goals, a number between 0 and 1 that shows how likely a shot was to be scored, based on the outcomes of similar shots in the past. A near-certain chance is close to 1. A shot with almost no chance is close to 0.
Is a high xG the same as a good result?
No. xG measures chance quality over the match, not who won. A team can generate more xG than their opponent and still lose, because xG says nothing about a red card, a big save, or a moment of individual quality.
What is a good xG total for a team in a match?
There is no fixed line. It depends on how many shots a team had and how good those shots were. xG is more useful compared over a run of matches than read as a single number from one game.
What is non-penalty xG (npxG)?
The same xG measure with penalty shots removed. It is used to judge chance quality from open play and set pieces without a scored penalty flattering the total.
Does FootyMetrics show xG?
Yes. Expected goals (xG) and expected assists (xA) are selectable stats on FootyMetrics, shown per player across our covered leagues. They sit alongside shots, shots on target, big chances created and missed, and shots created, so you can read chance quality and volume together.
Is a big chance the same as high xG?
Not exactly. A big chance is a separate tag applied to a clear opportunity, usually a one-on-one or a very close-range effort with a clear path to goal and low to moderate pressure. It is one of the inputs into an xG number rather than the same thing as xG itself.
Why do people say a team lost but had more xG?
It is a way of arguing a team created the better chances even though the scoreline went the other way. It is a real pattern worth looking at, but it is not proof the result was unfair. Small samples and randomness matter, especially in a single match.