Poisson and goals: the model behind over/under
Poisson is the maths that turns one number, a team's expected goals for a match, into a full set of over/under and correct-score probabilities. Feed it an average goal rate and it gives you the chance of exactly 0, 1, 2, 3 goals and up. Do that for both teams, add the two together, and you have a probability for over 2.5, under 2.5, both teams to score and every scoreline, all from two starting numbers.
Team FootyMetrics
Updated Jul 2026 · 7 min read
- Poisson takes an average rate (a team's expected goals) and returns the probability of 0, 1, 2, 3+ goals. That is the whole trick behind model-priced over/under and correct-score markets.
- Goals fit it reasonably well because they are discrete, whole-number events that arrive fairly rarely across 90 minutes.
- The fit isn't perfect: goals aren't fully independent, and basic Poisson slightly misprices low-scoring draws. The Dixon and Coles (1997) adjustment exists to fix exactly the 0-0, 1-0, 0-1 and 1-1 cells.
- The formula is short: P(k) equals lambda to the power of k, times e to the power of minus lambda, divided by k factorial, where lambda is the expected goals.
What the Poisson distribution does
The Poisson distribution gives the probability of a given number of events happening in a fixed interval, when those events arrive at a known average rate and, in the textbook version, independently of each other. That's the definition from the Poisson distribution page on Wikipedia, and it was worked out long before anyone applied it to football.
Swap events for goals and fixed interval for one match and the fit is easy to see. If a team is expected to score an average of 1.4 goals against a particular opponent, Poisson turns that single average into the probability of them scoring none, one, two, three or more. The average is the only input. Everything else is arithmetic.
The formula is:
P(k goals) = (lambda^k times e^-lambda) divided by k factorial
Here lambda (the Greek letter, said “lambda”) is the expected number of goals, k is the exact number you want the probability for, and e is the mathematical constant 2.718. The same Wikipedia page uses World Cup matches as a worked example, noting the average is about 2.5 goals a game and that the Poisson model is appropriate for it.
A worked example: 1.4 expected goals
Take a team expected to score 1.4 goals in a match, so lambda is 1.4. Put each value of k through the formula and you get:
- 0 goals: 24.7%
- 1 goal: 34.5%
- 2 goals: 24.2%
- 3 goals: 11.3%
- 4 goals: 3.9%
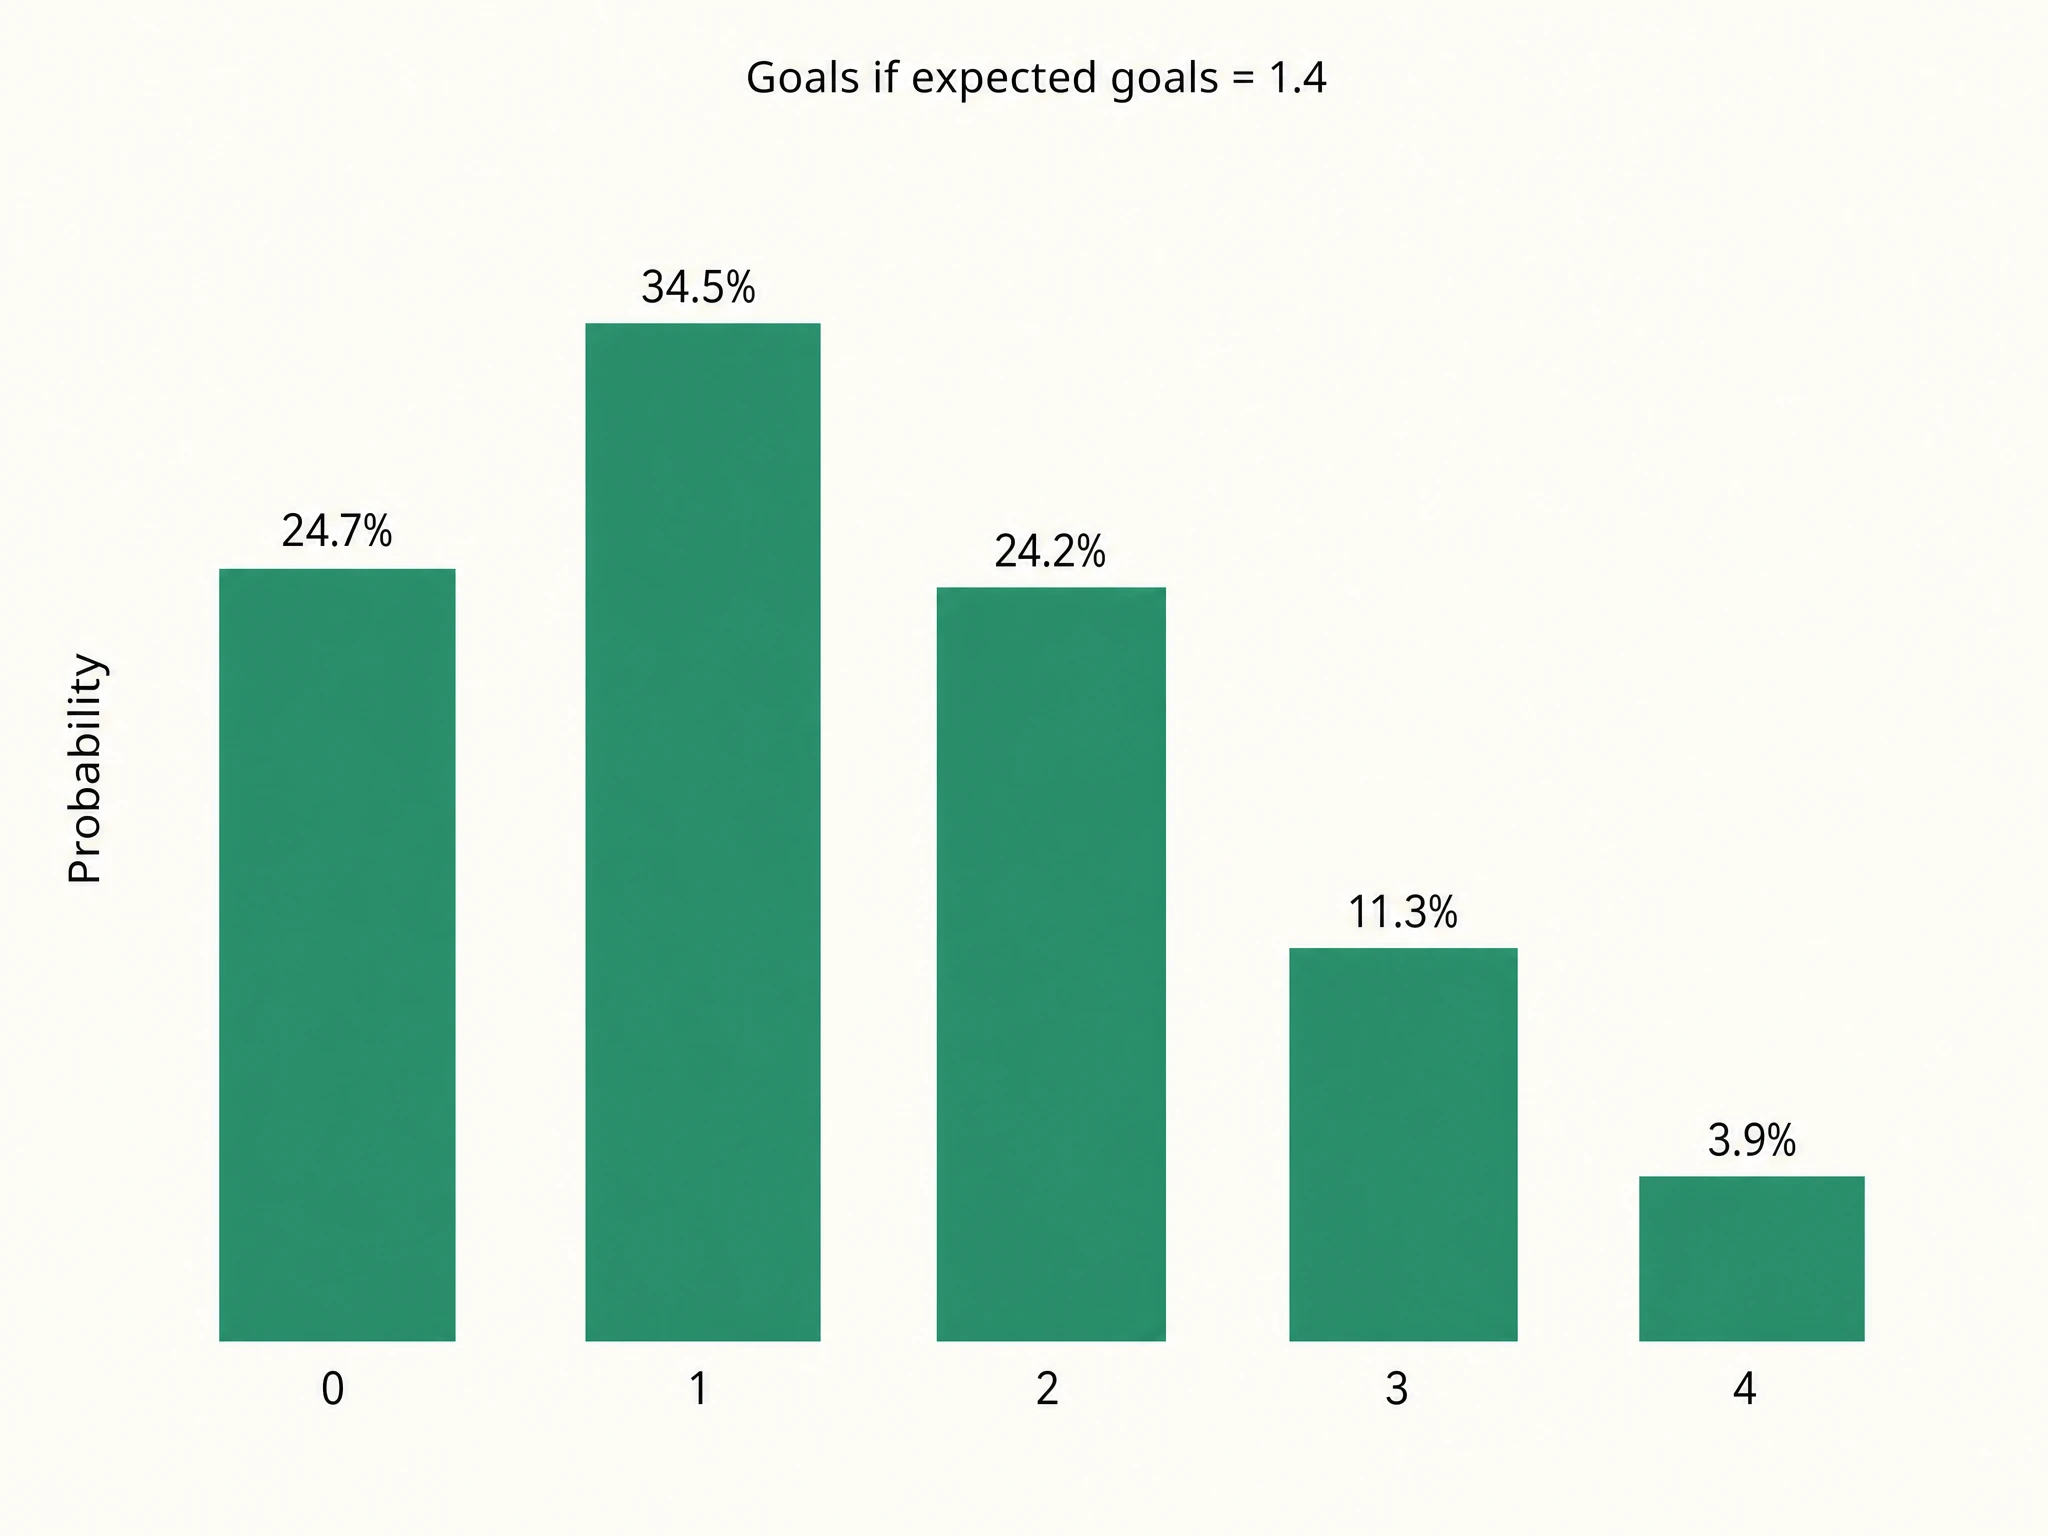
Those five add up to about 98.5%, with the last 1.5% spread across five or more. Notice the shape. The single most likely outcome is one goal, not the 1.4 average itself, because you can’t score 1.4 goals; the average sits between the one-goal and two-goal bars. And a team expected to score 1.4 still fails to score at all almost a quarter of the time. That’s worth sitting with, because it’s the reason a heavy favourite can draw a blank without the number behind them being wrong.
Turning two teams into an over/under 2.5 price
One team’s distribution only gets you halfway. A match has two of them, and the total-goals markets care about both added together.
Say the home side is expected to score 1.6 and the away side 1.1. Run each through Poisson to get their 0, 1, 2, 3+ distributions, then combine them. The chance the match finishes with two goals or fewer, an under 2.5, is every way that can happen: 0-0, plus 1-0 and 0-1, plus 2-0, 1-1 and 0-2. Add the probability of each of those scorelines and you get about 49.4% for under 2.5, which leaves 50.6% for over 2.5.
Two expected-goal figures, combined through Poisson, price a whole board: over/under, both teams to score, correct score and the match result.
That’s a genuine over/under price built from nothing but two expected-goal figures. The same combined table also gives you both teams to score (any scoreline where both numbers are one or more), the correct-score market (each individual cell), and the match result (sum the home-win, draw and away-win cells). One distribution per team, combined, prices a whole board.
Where Poisson breaks, and Dixon-Coles
Poisson is a starting point, not the last word, and it’s honest to say where it strains.
Its biggest assumption is independence: it treats every goal as unrelated to the ones before it. Football isn’t quite like that. A team that goes 2-0 up often sits deeper and sees the game out, which changes the rate at which further goals arrive, so goals late in a match aren’t truly independent of the score. The basic model can’t see that.
The better-known problem is low scores. Plain Poisson slightly misprices the cluster of results around 0-0, 1-0, 0-1 and 1-1, tending to undercount draws in particular. This isn’t a vague criticism; it’s a specific, documented flaw. Mark Dixon and Stuart Coles published a fix in 1997 (Modeling Association Football Scores and Inefficiencies in the Football Betting Market, Applied Statistics 46(2), 265-280), adding a correlation factor that adjusts exactly those four low-scoring cells where the independent-Poisson assumption holds up worst, as summarised on Wikipedia’s statistical football predictions page. Most goals-based models in use today are some descendant of that Dixon-Coles adjustment rather than raw Poisson.
Why the low-scoring cells matter most
None of this makes the approach useless. It makes it a reasonable, well-studied base you then correct, which is how most serious modelling works.
How this fits a full prediction model
Poisson is the goals engine, but a real model spends most of its effort on the step before it: working out what each team’s expected goals for a specific match should be in the first place. That’s where form, expected goals from past matches, home advantage and the opponent’s defence come in. How a football prediction model works covers that wider pipeline, of which Poisson is one component. If you’re new to the expected-goals input that feeds it, what is expected goals (xG) is the place to start.
The output is a set of probabilities, not a prediction of a single scoreline. A model that says over 2.5 is 50.6% isn’t claiming the match will go over; it’s saying that if this fixture were played many times, it would clear 2.5 goals in about half of them. That gap between a model’s probability and a bookmaker’s price is where value betting lives. FootyMetrics publishes its own AI match predictions across 115+ leagues, and they come out the same way: a probability for each outcome rather than a tip.
See today's match predictions
Outcome probabilities for every match across 115+ leagues, produced the same way for every game: a probability for each result, not a single pick.
Poisson and goals FAQs
Why is the Poisson distribution used for football goals?
Goals are discrete, whole-number events that occur at a fairly low average rate across a match, which is the kind of thing the Poisson distribution was built to describe. Given a team's expected goals, it returns the probability of them scoring exactly 0, 1, 2, 3 or more, which can be combined into over/under, correct-score and both-teams-to-score prices.
What is the Poisson formula for goals?
P(k) equals lambda to the power of k, times e to the power of minus lambda, divided by k factorial. Lambda is the team's expected goals for the match, k is the exact number of goals you want the probability of, and e is roughly 2.718. For lambda of 1.4, this gives about 24.7% for no goals, 34.5% for one and 24.2% for two.
How do you get an over/under 2.5 probability from Poisson?
Work out each team's goal distribution from its own expected goals, then combine them into a table of scoreline probabilities. Add up every scoreline totalling two goals or fewer to get the under 2.5 probability; the rest is over 2.5. For a 1.6 versus 1.1 expected-goals match, that comes out near 49.4% under and 50.6% over.
What is the Dixon-Coles adjustment?
It is a correction to the basic Poisson model, published by Dixon and Coles in 1997, that adjusts the probabilities of the four low-scoring results (0-0, 1-0, 0-1, 1-1) where plain Poisson fits worst. Independent Poisson tends to undercount draws, and the adjustment adds a correlation factor to fix those cells.
Is a Poisson goals model accurate?
It is a reasonable base rather than a finished answer. Goals are not perfectly independent, since a team leading 2-0 often changes how it plays, and basic Poisson mishandles low scores. Most working models start from Poisson and apply corrections such as Dixon-Coles rather than using it raw.
Does FootyMetrics use a Poisson model?
FootyMetrics publishes AI match predictions across 115+ leagues as a probability for each outcome. This page describes the general modelling approach the industry uses rather than the exact internal method behind any one provider's numbers.